Well folks, I hate to do this, but it's time for some changes...
As you know, one thing that makes this blog unique is that I post all of my transactions in real time and real dollars. The great thing about this is that I have an audit trail and verifiable track record. However, there's also a downside...
For one, the blog is now mostly focused on logging my trades, which isn't much fun for me and probably isn't that interesting to you. I mean aren't you tired of all my posts on buying/selling Sears?! I'm also worried about blogging induced style drift - am I more risk adverse, does "talking my book" create commitment bias, etc.?
Now, I might have been willing to live with this if it were just my own money, but recently I took on outside investors. This means I need to be very careful about anything that can bias my decisions or impede my investing process.
So, where do we go from here? For starters I will no longer log my trades. And as for the rest of the blog, well I'm still trying to figure that out... stay tuned!
Questions? Comments? Email mevsemt@gmail.com.
Showing posts with label Returns. Show all posts
Showing posts with label Returns. Show all posts
Sunday, February 16, 2014
Sunday, January 12, 2014
2013 Summary
Alright folks, 2013 is over and 2014 is underway. Frankly, I'm not sure what to think about last year's performance. On the one hand, my absolute returns were decent, and that's despite my very conservative cash position. On the other hand, I under performed the S&P, which is never a good thing.
Questions? Comments? Email mevsemt@gmail.com.
Speaking of the S&P, it was up an astounding 32.3% last year! On a percentage basis, that's better than the bounce we saw in 2009 (which was only 30.4%). In fact, this is the market's single best year since I began investing (which was 8 years ago). And, on top of all that, this is the 5th straight year market's been up.
So where does this leave us? Well frankly, as a value investor, this has all been a bit frustrating. After all, the more "stretched" valuations become, the more difficult it is to find companies trading at a discount to their intrinsic value. In fact, right now the most compelling opportunities are the ones that have something "wrong" with them (like Sears and Strayer). If companies like these can be "fixed," the payoff can be huge, but there's execution risk...
Anyway, here's the summary:


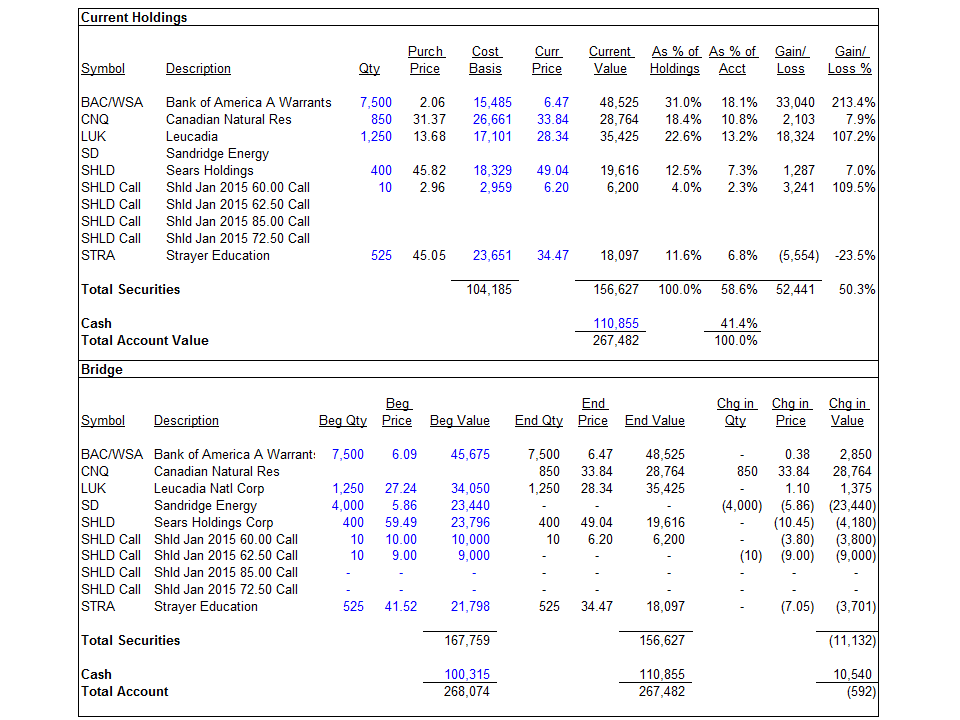
- I started the year with $213,090 and finished with $267,482. Since I didn't deposit or withdraw any money, this increase is straight appreciation.
- In percentage terms, my portfolio was up 25.5% in 2013, whereas the Hypothetical S&P appreciated 32.3%.
And here are the exhibits (8 year performance summary, waterfall graphs, holdings summary, and quarter-to-quarter bridge, click to enlarge):
Questions? Comments? Email mevsemt@gmail.com.


Thursday, October 3, 2013
Q3 Discussion
Well folks, looks like it's time for my Q3 discussion and analysis. And while I hate to count my chickens before they're hatched, it looks like my portfolio has finally awakened from it's slumber.
More specifically, an unsustainable short interest in Sears coupled with a bullish report from Baker Street Capital caused the stock to shoot up in September. I responded by trimming my position and locking in some gains. However, as you'll see in the exhibits below, Sears is still very much a core holding.
So what else is going on? Well frankly, I'm as nervous as ever about valuations in the market, and as a result I'm holding a lot of cash (37.4% of portfolio). Furthermore, although I continue to search for new opportunities, I repeatedly come up empty handed. In fact, these days the market reminds me a little of 2005-07. Maybe this makes me the investing equivalent of Chicken Little, but at least I sleep well at night.
Anyway, here's the summary:
Anyway, here's the summary:
- I came into the year with $213,090 and ended the quarter with $268,074. I didn't deposit or withdraw any money, so this increase is straight appreciation.
- My portfolio has increased about 25.8% YTD (35.6% IRR), whereas the Hypothetical S&P has increased about 19.7% YTD (27.2% IRR).
And here are the exhibits (7+ year performance summary, waterfall graphs, holdings summary, and quarter-to-quarter bridge, click to enlarge):


Questions? Comments? Email mevsemt@gmail.com.


Questions? Comments? Email mevsemt@gmail.com.
Wednesday, July 10, 2013
Nothing to see here...
Looks like we're over the hump folks, and with the year half over I guess it's time for another quarterly update...
Frankly, I wish I had better news to report, but after a very strong 2012, my portfolio has trailed the S&P in 2013. So what's going on here? Well, for one I've had a large % of my portfolio in cash, which has obviously been an anchor on performance. I also haven't had any real winners this year. Instead, my holdings seem to be just floating along. Oh well, my returns have always been lumpy, so I'm not going to get too worked up...
Anyway, here's the summary:
- I came into the year with $213,090 and ended the quarter with $230,183. I didn't deposit or withdraw any money, so this increase is straight appreciation.
- My portfolio has increased about 8.0% YTD (16.8% IRR), whereas the Hypothetical S&P has increased about 13.7% (29.7% IRR).
As always, see below for the following exhibits: 7+ year performance summary, waterfall graph, holdings summary, and quarter-to-quarter bridge (values as-of 6/30/2013, click to enlarge).


So what's next? Well, I'm still worried the market is a little too frothy and I'm not finding many new bargains, so for now my plan is to just sit tight. Of course if anything changes I'll let you know!
Questions? Comments? Email mevsemt@gmail.com


So what's next? Well, I'm still worried the market is a little too frothy and I'm not finding many new bargains, so for now my plan is to just sit tight. Of course if anything changes I'll let you know!
Questions? Comments? Email mevsemt@gmail.com
Wednesday, April 24, 2013
Better Late than Never - Q1 Update
Well, here we are at the end of April, and I'm just now getting around to posting my Q1 results, sorry folks. Frankly, there's nothing too exciting to talk about here - I tweaked my SHLD position and LUK merged with JEF, so nothing earth-shattering. Anyway, here's a quick summary (keep in mind that my returns & portfolio are as-of 3/31/2013, so they won't include Sandridge, which I bought in April):


- I came into the year with $213,090 and ended the quarter with $233,138. I didn't deposit or withdraw any money, so this increase was straight appreciation.
- My portfolio increased about 9.4% for the quarter (44.0% IRR), whereas the Hypothetical S&P increased about 10.5% (49.9% IRR).
Below are the following exhibits: 7+ year performance summary, waterfall graph, holdings summary, and quarter-to-quarter bridge (all values & holdings are as-of 3/31/2013, click to enlarge).


As always, please don't hesitate to drop me a line if you have questions, comments, or stock ideas (especially that last one!). In the meantime, good luck out there!
Email mevsemt@gmail.com
Saturday, January 12, 2013
2012 Returns
Well, it looks like we've got another year under our belts. And while 2012 was not particularly exciting in terms of activity/trading, it was absolutely thrilling in terms of performance. In fact, relative to the S&P, 2012 was my single best year!
So how'd this happen? Well, if I had to guess, I'd say it was some combination of luck and temperament (with luck getting the lion's share of the credit). As you'll recall, I came into 2012 with just 5 companies (AIG, BAC, JEF, LUK, and SHLD). During the year I completely sold AIG, and from time to time tweaked my SHLD position. Otherwise, I basically just sat on my ass for 12 months.
In terms of what drove performance, AIG and BAC (both TARP warrants) were the major contributors. Between 12/31/2011 and when I sold in April, AIG/WS went from $5.51 to $12.65 (not bad for 5 months!). BAC/WS, which I still hold, started the year at $2.02 and finished at $5.42.
As for 2013, it should be another interesting year. LUK and JEF are scheduled to merge in Q1, which will leave me with only 3 companies (excluding spin offs, which are not a meaningful % of my portfolio). In terms of position sizing, this is easily the most concentrated I've ever been. However, with 42% of my portfolio in cash, I think I can handle a little company-specific risk. Also, I get pretty nervous with the market trading around multi-year highs, and cash helps me sleep better at night!
Lastly, my expectations are still high for Sears. I think Eddie taking over as CEO is interesting, and my hope is we'll see more asset sales and/or corporate transactions as a result. Who knows, if Sears really does become the next Berkshire, maybe more people will start reading my blog!
Anyway, here's a quick summary of 2012:


So how'd this happen? Well, if I had to guess, I'd say it was some combination of luck and temperament (with luck getting the lion's share of the credit). As you'll recall, I came into 2012 with just 5 companies (AIG, BAC, JEF, LUK, and SHLD). During the year I completely sold AIG, and from time to time tweaked my SHLD position. Otherwise, I basically just sat on my ass for 12 months.
In terms of what drove performance, AIG and BAC (both TARP warrants) were the major contributors. Between 12/31/2011 and when I sold in April, AIG/WS went from $5.51 to $12.65 (not bad for 5 months!). BAC/WS, which I still hold, started the year at $2.02 and finished at $5.42.
As for 2013, it should be another interesting year. LUK and JEF are scheduled to merge in Q1, which will leave me with only 3 companies (excluding spin offs, which are not a meaningful % of my portfolio). In terms of position sizing, this is easily the most concentrated I've ever been. However, with 42% of my portfolio in cash, I think I can handle a little company-specific risk. Also, I get pretty nervous with the market trading around multi-year highs, and cash helps me sleep better at night!
Lastly, my expectations are still high for Sears. I think Eddie taking over as CEO is interesting, and my hope is we'll see more asset sales and/or corporate transactions as a result. Who knows, if Sears really does become the next Berkshire, maybe more people will start reading my blog!
Anyway, here's a quick summary of 2012:
- I started the year with $138,179, and in June I withdrew $10K from my account. I ended the year with $213,090. That's $84.9K of straight appreciation.
- My IRR for 2012 was 63.3% vs. 15.2% for the S&P (assumes dividends reinvested and $10K had been withdrawn from my "Hypothetical S&P" portfolio, thus keeping the comparison to be apples-to-apples).
Below are the following: 7 year performance summary, waterfall graph, holdings summary, and quarter-to-quarter bridge (all values are as-of 12/31/2012, click to enlarge).


Questions? Comments? Email mevsemt@gmail.com
Saturday, October 20, 2012
All man's miseries... (Q3 D&A)
So, it occurs to me that my blog is becoming pretty damn boring. In fact, in terms of trading, I'd say my 2012 portfolio activity is slightly less exciting than watching paint dry. How come?
Well, maybe you've heard the saying, "All man's miseries derive from not being able to sit in a quiet room alone" (Pascal). Or, if you're a value investing groupie like me, maybe you remember Pabrai saying "The correct way to set [the investment business] up is to have gentlemen of leisure, who go about their leisurely tasks, and when the world is severely fearful is when they put their leisurely tasks aside and go to work."
So where's the fear? Sure, we hear about our growing debt/deficit, our political system is a mess, and global tensions continue to rise. But the market continues to hit new highs! Meanwhile, I continue to pare back investments and raise cash. So are investors, collectively speaking, whistling past the graveyard? Or am I the investing equivalent of chicken little?
Anyway, going back to Pascal and Pabrai, I think this is the perfect time to sit on your ass and do nothing. Remember, when it comes to investing, temperament is half the battle, and being comfortable with inactivity (and a high % of cash) can really come in handy.
Anyway, now that I've put in my 2 cents, let's talk performance.


Questions? Comments? Email mevsemt@gmail.com
Well, maybe you've heard the saying, "All man's miseries derive from not being able to sit in a quiet room alone" (Pascal). Or, if you're a value investing groupie like me, maybe you remember Pabrai saying "The correct way to set [the investment business] up is to have gentlemen of leisure, who go about their leisurely tasks, and when the world is severely fearful is when they put their leisurely tasks aside and go to work."
So where's the fear? Sure, we hear about our growing debt/deficit, our political system is a mess, and global tensions continue to rise. But the market continues to hit new highs! Meanwhile, I continue to pare back investments and raise cash. So are investors, collectively speaking, whistling past the graveyard? Or am I the investing equivalent of chicken little?
Anyway, going back to Pascal and Pabrai, I think this is the perfect time to sit on your ass and do nothing. Remember, when it comes to investing, temperament is half the battle, and being comfortable with inactivity (and a high % of cash) can really come in handy.
Anyway, now that I've put in my 2 cents, let's talk performance.
- I came into the year with $138,179, and in June I withdrew $10K from my account. I finished Q3 with $209,194.
- My annualized rate of return for 2012 is 86.9% vs. 21.1% for the S&P (assumes dividends reinvested and 10K had been withdrawn from my "Hypothetical S&P" portfolio, thus keeping the comparison to be apples-to-apples).


Questions? Comments? Email mevsemt@gmail.com
Saturday, July 7, 2012
Q2 Review and Commentary
Before I get into a review of my holdings and performance, let's do a little housekeeping. On June 25th, I withdrew $10,000 from my account. This is shown on the "My Returns So Far" page (link to the right) and is also reflected in all the quarter-end exhibits further down.
Additionally, as I'm typing, it occurs to me that I haven't written a new post since April (when I sold my AIG warrants), so I apologize for the lack of activity. It's not that I haven't been thinking about investing, it's just that I haven't had anything especially insightful to say or do. It's also worth mentioning that the AIG transaction took me to roughly 45% cash, and given the recent market decline, the timing couldn't have been better. In fact, in my April post I lamented, "with the overall market close to it's 52-week high, I thought now may be a good time to raise some cash for the next rainy day."


Additionally, as I'm typing, it occurs to me that I haven't written a new post since April (when I sold my AIG warrants), so I apologize for the lack of activity. It's not that I haven't been thinking about investing, it's just that I haven't had anything especially insightful to say or do. It's also worth mentioning that the AIG transaction took me to roughly 45% cash, and given the recent market decline, the timing couldn't have been better. In fact, in my April post I lamented, "with the overall market close to it's 52-week high, I thought now may be a good time to raise some cash for the next rainy day."
Alright, now let's get to the good stuff.
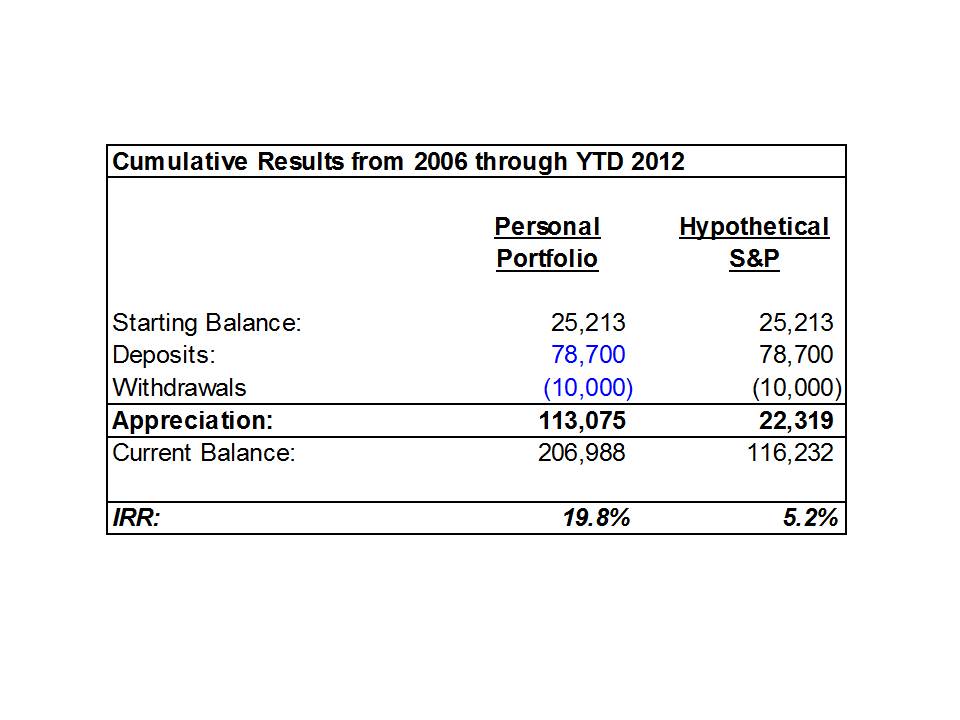
- I came into the year with $138,179. At the end of Q1 I had $246,569, and I finished Q2 with $206,988. Had I not withdrawn the $10K, I would've finished the quarter with $216,988.
- Although I went backward in Q2, the good news is I'm still way ahead of the S&P for the year. In fact, for the first six months I'm up roughly 57%, whereas the S&P is only up 9%.
Below are the following exhibits: 6+ year performance summary, waterfall graph, holdings summary, and quarter-to-quarter bridge (all values are as-of 6/30/2012, click to enlarge).


I remain as comfortable as ever with my current holdings (BAC, JEF, LUK, and SHLD). In fact, given the market's recent pullback, I think all of them represent pretty compelling values. Even more importantly, they're all run by fantastic leaders who are focused on building shareholder value.
BAC continues to strengthen their balance sheet and has made significant progress with their back-to-basics business transformation. In the not-to-distant future, they should be allowed to start returning cash to shareholders via dividends and buybacks. In Moynihan we trust!
As CEO Handler says about JEF, "We are the nicest property in a devastated neighborhood." Well I guess that's one way to put it! The fact is JEF operates in what could be a pretty attractive industry. Unlike their peers (Goldman Sachs, Morgan Stanley, etc.), JEF has used the recent economic turmoil to hire talent and make acquisitions on the cheap. Over the next few years, I think we'll see significant earnings growth as these investments start to pay off.
I don't have a whole lot to say about LUK. I'm not thrilled that their Chairman, Ian Cumming, has indicated that he doesn't plan on renewing his employment contract in 2015. However, I am confident that LUK leadership will continue to faithfully build wealth for their shareholders, and I'm curious see what Justin Wheeler (the new COO) can accomplish in his expanded role.
And of course there's SHLD. I've written about this one ad nauseum, so I'm going to keep it short. However, to even the passive observer, it's clear the transformation has begun. So, even if you're not a shareholder I'd keep an eye on this one, things could get interesting.
And finally, let's talk about what's next. Given my high cash %, I'm looking to put some money to work. However, I find myself struggling to actually pull the trigger (which is nothing new). Part of it's the hope that stocks will get cheaper. The other issue is that I've found a handful of opportunities that are pretty compelling, but I'm having trouble deciding which 1 or 2 to buy. Here's what I'm looking at most closely: CNQ, VRX, JCP, SCHW, EXPD, SD, XCO, and AIG. Interestingly enough, I've previously owned JCP, SD, and AIG. If anyone has researched any of these companies, feel free to share!
Questions? Comments? Email mevsemt@gmail.com
BAC continues to strengthen their balance sheet and has made significant progress with their back-to-basics business transformation. In the not-to-distant future, they should be allowed to start returning cash to shareholders via dividends and buybacks. In Moynihan we trust!
As CEO Handler says about JEF, "We are the nicest property in a devastated neighborhood." Well I guess that's one way to put it! The fact is JEF operates in what could be a pretty attractive industry. Unlike their peers (Goldman Sachs, Morgan Stanley, etc.), JEF has used the recent economic turmoil to hire talent and make acquisitions on the cheap. Over the next few years, I think we'll see significant earnings growth as these investments start to pay off.
I don't have a whole lot to say about LUK. I'm not thrilled that their Chairman, Ian Cumming, has indicated that he doesn't plan on renewing his employment contract in 2015. However, I am confident that LUK leadership will continue to faithfully build wealth for their shareholders, and I'm curious see what Justin Wheeler (the new COO) can accomplish in his expanded role.
And of course there's SHLD. I've written about this one ad nauseum, so I'm going to keep it short. However, to even the passive observer, it's clear the transformation has begun. So, even if you're not a shareholder I'd keep an eye on this one, things could get interesting.
And finally, let's talk about what's next. Given my high cash %, I'm looking to put some money to work. However, I find myself struggling to actually pull the trigger (which is nothing new). Part of it's the hope that stocks will get cheaper. The other issue is that I've found a handful of opportunities that are pretty compelling, but I'm having trouble deciding which 1 or 2 to buy. Here's what I'm looking at most closely: CNQ, VRX, JCP, SCHW, EXPD, SD, XCO, and AIG. Interestingly enough, I've previously owned JCP, SD, and AIG. If anyone has researched any of these companies, feel free to share!
Questions? Comments? Email mevsemt@gmail.com
Friday, March 30, 2012
Returns as of Q1 2012
Well I'll just come out and say it... this was a great quarter! As you may recall, after a rough 2011, I entered 2012 with a very concentrated portfolio of just 5 companies. Interestingly enough, two of these companies (BAC and SHLD) had been major contributors to last year's poor performance. Here's a quote from my year end write-up (http://mevsemt.blogspot.com/2012/01/2011-returns.html):
So what went wrong in 2011? Three things: SHLD, BAC, and JOE. And I'm not sure whether to call it stubbornness or arrogance, but I've effectively doubled down on Sears and re-initiated a significant position in BAC. My hope is 2012 will prove to be a better year for these struggling companies, and with Sears's assets and BAC's core business, they both have a ton of potential.
So far it looks like my stubbornness has paid off, as both companies have rallied quite a bit. Here's a quick summary of where I stand overall:
So what went wrong in 2011? Three things: SHLD, BAC, and JOE. And I'm not sure whether to call it stubbornness or arrogance, but I've effectively doubled down on Sears and re-initiated a significant position in BAC. My hope is 2012 will prove to be a better year for these struggling companies, and with Sears's assets and BAC's core business, they both have a ton of potential.
So far it looks like my stubbornness has paid off, as both companies have rallied quite a bit. Here's a quick summary of where I stand overall:
- I came into the year with $138,179. As of 3/31/2012, my portfolio had appreciated to $246,569, for a total gain of $108,390. Since I didn't deposit/withdraw any money, this increase was straight appreciation.
- My portfolio is up 78% YTD, while the S&P is up 12%.
On a cumulative basis, my returns for the last 6 years and 3 months are summarized below vs. the S&P (click all pictures to enlarge). I also updated the "My Returns So Far..." page to the right.
 Here's a waterfall graph that shows a little more detail. The blue bars are the beginning and ending balances, the green bars show appreciation/depreciation, and the red bars represent deposits.
 Below are my current holdings, along with their current value, cost basis, and any unrealized gain/loss.
 I also added a new display - a bridge between 12/31/2011 and 3/31/2012. As you can see, I exited one position during the quarter (SHLD Jan 2013 calls for $18.2K), which is reflected in the increased cash balance.
 As for closing remarks, I'd like to stress that with a portfolio as concentrated as mine, sometimes the stars will align and things will work out for no other reason than dumb luck. Going forward, I don't expect to ever have another quarter like this one, nor do I expect to continue beating the S&P by the almost 20% per annum I've done historically. However, my hope is I'll continue to beat the market by a reasonable amount, after all the name of my blog is "Me vs. Efficient Market Theory."
As always, I'm happy to answer questions and I appreciate comments. Feel free to email me at mevsemt@gmail.com.


As always, I'm happy to answer questions and I appreciate comments. Feel free to email me at mevsemt@gmail.com.
Sunday, January 1, 2012
2011 Returns
Yikes. Ouch. Crap. Well, that about sums it up for 2011. Here's a quick summary:
- I came into the year with $126,967. During the year I deposited $35,000 into my account. By year end my holdings had DEPRECIATED by $23,788, leaving me with $138,179.
- My IRR for 2011 was -15.7% vs. +1.0% for the S&P (assumes dividends are reinvested AND the $35K I deposited was used to buy additional SPY shares at that day's closing price).
Although 2011 was a kick in the teeth, my cumulative returns for the past 6 years are still well ahead of the S&P. Below are the details (click to enlarge):
 I also included a waterfall graph that shows a little more detail. The blue bars are the beginning and ending balances, the green bars show appreciation/depreciation, and the red bars represent deposits (click to enlarge):
 And lastly here are my current holdings (click to enlarge):
 So what went wrong in 2011? Three things: SHLD, BAC, and JOE. And I'm not sure whether to call it stubbornness or arrogance, but I've effectively doubled down on Sears and re-initiated a significant position in BAC. My hope is 2012 will prove to be a better year for these struggling companies, and with Sears's assets and BAC's core business, they both have a ton of potential. I'm also optimistic on the rest of my portfolio, but due to macro uncertainty, I'm also keeping a large % of cash.
Questions? Comments? Email mevsemt@gmail.com.


Questions? Comments? Email mevsemt@gmail.com.
Sunday, October 2, 2011
Returns as of Q3 2011
Man, these last two quarters have been miserable! Not only have my returns been negative, but they've lagged the S&P too. Oh well, I guess this type of thing happens with a concentrated portfolio. Besides, over the last 5+ years I've managed to outperform the S&P by roughly 10% per year, so I'm still hopeful I'm doing something right! Anyway, here's a quick summary of where I stand for 2011:
 I also included a waterfall graph that shows a little more detail. The blue bars are the beginning and ending balances, the green bars show appreciation/depreciation, and the red bars represent deposits (click image to enlarge):
 So what about my holdings in particular? Well, in general I'm still cautiously optimistic. In fact, I think some of my holdings have gotten down right cheap, especially SHLD, JOE, and AIG. I'm also surprised we're seeing LUK trade this close to book value. I mean these guys have compounded book value at 20% per year for 3+ decades and there's no premium on the stock price whatsoever! Of course there's also plenty to be worried about; Europe's a mess, China's growth may be slowing, and Washington is slightly less functional then my 21-month-old daughter's daycare class. Anyway, below is a snapshot of my current holdings as of 9/30/2011 (click image to enlarge):
 Questions? Comments? Email mevsemt@gmail.com.
- I came into the year with $126,967. During the year I've deposited $35,000 into my account. YTD my holdings have DEPRECIATED by $22,073, leaving me with $139,894 as of 9/30/2011.
- YTD my annualized IRR has been -19.4% vs. -15.0% for the S&P (assumes dividends are reinvested AND the $35K I deposited was used to buy additional SPY shares at that day's closing price).


Thursday, June 30, 2011
Q2 2011 Returns
Well it looks like we've got another quarter under our belt, so that means it's time for another performance update. However, this time around I've added some new exhibits I think you'll like, so read on!
![]()
Additionally, I've also included a summary report that compares my portfolio to the S&P from 2006 through Q2 2011. As you can see, the differing IRR's have had a huge impact on the respective ending balances.
![]() Lastly, I wanted to take a sentence or two to talk about my holdings and the market in general. With regards to the market I have absolutely no idea whether it's under or overvalued, although my gut tells me to err on the side of caution (which is why my cash balance is so high). As for my specific holdings I'm actually pretty optimistic - I think CSCO and BAC are significantly undervalued and should do well over time. As for LUK and TTT I expect the owner/operators to continue deploying capital and earning attractive returns for shareholders. Lastly, I think SHLD and JOE are both undervalued and misunderstood (AND they are also controlled by two of the best capital allocators out there) - so while I have no idea what the future will bring I think the market is significantly underestimating the upside at these prices. Anyway, see below for a snapshot of my portfolio as of 6/30/2011 (click to enlarge).
Lastly, I wanted to take a sentence or two to talk about my holdings and the market in general. With regards to the market I have absolutely no idea whether it's under or overvalued, although my gut tells me to err on the side of caution (which is why my cash balance is so high). As for my specific holdings I'm actually pretty optimistic - I think CSCO and BAC are significantly undervalued and should do well over time. As for LUK and TTT I expect the owner/operators to continue deploying capital and earning attractive returns for shareholders. Lastly, I think SHLD and JOE are both undervalued and misunderstood (AND they are also controlled by two of the best capital allocators out there) - so while I have no idea what the future will bring I think the market is significantly underestimating the upside at these prices. Anyway, see below for a snapshot of my portfolio as of 6/30/2011 (click to enlarge).
![]()
Questions? Comments? Email mevsemt@gmail.com.
- I came into the year with $126,967 and since then deposited $35,000 into my account. YTD my holdings have appreciated by $8,340, leaving me with $170,307 as of 6/30/2011.
- YTD my IRR has been 12.4%, whereas the IRR of my hypothetical S&P Portfolio is 11.3% (assumes dividends are reinvested AND the $35K I deposited was used to buy additional SPY shares at that day's closing price).

Additionally, I've also included a summary report that compares my portfolio to the S&P from 2006 through Q2 2011. As you can see, the differing IRR's have had a huge impact on the respective ending balances.


Questions? Comments? Email mevsemt@gmail.com.
Friday, April 1, 2011
Q1 2011 Returns
It looks like my good luck from Q4 of 2010 has continued into 2011, here's a quick summary of my performance for the first quarter:
- I came into the year with $126,967 and finished Q1 with $145,937, for a gain of $18,970 (this increase was straight appreciation as I didn't deposit any money into my account).
- On a percentage basis my portfolio increased by 14.9% during the quarter, while the S&P only gained 5.9%.
- I've been tracking my returns for 5 years and 3 months, during which time my annual rate of return has been 21.4%. Had I invested in the S&P my annual return would've been 5.7%, or 15.7% lower PER YEAR.

If you'd like to see where I started the year click here for my yearend 2010 write-up - http://mevsemt.blogspot.com/2011/01/alls-well-that-ends-well.html. If you'd like a little more detail on how I calculate my returns click on the "My Returns So Far..." link to the right. Lastly, as you can see I have a very concentrated portfolio, so I want to emphasize that my performance over the last 5 years could be heavily influenced by nothing other than dumb luck (but I like to think I'm doing something right).
Questions? Comments? Email mevsemt@gmail.com
Saturday, January 1, 2011
All's well that ends well???
2010 was interesting, for most of the year my returns lagged the S&P (click "Returns" under labels for all the details). In fact, going into Q4 my portfolio was DOWN 2.8% whereas the S&P was UP 3.5%. This being the case, I didn't think I'd actually beat the market this year (btw I'm sure there will be PLENTY of years where I lag the S&P). Luckily, during the fourth quarter things turned around, and several of my holdings did quite well:

Now with all that out of the way, what are my thoughts going into 2011? Well, the recent market rally has made me pretty nervous about both valuations in general and my portfolio in particular. Following is a brief discussion about my portfolio as well as a few names on my watch list:
[1] The $126,967 is understated because TTT is trading ex-div BUT the spunoff KHDHF shares haven't been deposited in my portfolio yet (b/c KHDHF is traded in Germany). Anyway, my 2,268 shares of TTT translates to 226 shares of KHDHF. Since KHDHF closed the year at $9.00 these shares are worth $2,034. This means my portfolio balance is really $129,001, giving me a return of about 20%, but for consistency I'm going to stick with my official statements as reported by TradeKing.
- SandRidge - I purchased SandRidge 2012 LEAPS at the end of August for $5,387 and as of year end they're worth $13,600 (for a total return of 152% in just over 4 months). Click here for the original post: http://mevsemt.blogspot.com/2010/08/fool-me-once.html
- Jackson Hewitt - I bought Jackson Hewitt call options in the middle of September. This started as a very speculative $525 bet, but now these options are worth $4,140. Here are the related posts: http://mevsemt.blogspot.com/2010/09/all-or-nothing.html and http://mevsemt.blogspot.com/2010/12/jtx-follow-up.html.
- Sears - I bought 2013 LEAPS in November and December (http://mevsemt.blogspot.com/2010/11/transaction-alert-sears-holdings-2013.html and http://mevsemt.blogspot.com/2010/12/more-sears-leaps-in-eddie-we-trust.html) for a total outlay of $9,323. Sears stock has jumped since then, and so has the value of the LEAPS (which are now worth $13,500).
- On an absolute basis, my portfolio gained 18.1% for the year while the S&P (w/ dividends reinvested) was up 14.6%.
- I've been tracking my returns for 5 years, during which time my annual rate of return is 18.4%. Had I invested in an S&P index fund (and reinvested dividends) my annual returns would be 4.4%. In other words, I've outperformed the S&P by 14.0% per annum.
- Click on the "My Returns So Far..." link to the right for full details and to see how this outperformance translates into real dollars - it's actually pretty significant.

Now with all that out of the way, what are my thoughts going into 2011? Well, the recent market rally has made me pretty nervous about both valuations in general and my portfolio in particular. Following is a brief discussion about my portfolio as well as a few names on my watch list:
- I'd like to increase my cash position after the recent run up. In fact, I could see it going over $30K in the near future. I have to sell JTX b/c the options expire in a couple weeks. I'm also considering selling COV/HAWK outright and maybe trimming a few other positions.
- My watch list is perhaps as small as it's ever been. It includes CSCO, BAC, NRG, and maybe 2 or 3 other names. These names haven't participated in the recent market rally and IMO could be somewhat resilient if the market pulls back.
- Call me crazy, but I think something could happen with Sears in 2011. Of course I have no idea what that "something" might be, but the possibilities include selling real estate, increased brand distribution, a short squeeze... heck, I've even read speculation that Sears, Autozone, and/or Autonation could merge one day. I should also emphasize that my purchase of Sears LEAPS had nothing to do with any of this (but it's fun to speculate!).
- I think SandRidge will continue to do well. It was one of the first natural gas E&P companies to focus on oil and it did so very aggressively. Also, recent (and future) asset sales have given the market a glimpse into how valuable this company could be, and the stock has responded accordingly.
- Lastly, I think we might see TTT make an acquisition. I think the company's significant cash hoard is burning a hole in Michael Smith's pocket, and I'm very interested to see if he can come up with something.
[1] The $126,967 is understated because TTT is trading ex-div BUT the spunoff KHDHF shares haven't been deposited in my portfolio yet (b/c KHDHF is traded in Germany). Anyway, my 2,268 shares of TTT translates to 226 shares of KHDHF. Since KHDHF closed the year at $9.00 these shares are worth $2,034. This means my portfolio balance is really $129,001, giving me a return of about 20%, but for consistency I'm going to stick with my official statements as reported by TradeKing.
Wednesday, October 13, 2010
My Returns as of Oct. 12th 2010
When I posted my returns at the end of Q3 one reader correctly pointed out that I wasn't showing my cost basis for each holding. At the time TradeKing was doing some sort of behind-the-scenes IT conversion and didn't display cost basis on their summary pages. They've since finished the conversion, so I thought I'd post a quick update on my returns and update the "My Returns So Far..." and "My Current Holdings" pages.
I started 2010 with $107,514 and as of 10/12/2010 my account balance is $108,885 (Note: as of Q3 when I last posted about my returns my balance was $104,494, so this is quite a jump in the last 2 weeks). YTD I haven't made any deposits or withdrawals, so the increase in value was driven by an aggregate increase in my holdings.


I started 2010 with $107,514 and as of 10/12/2010 my account balance is $108,885 (Note: as of Q3 when I last posted about my returns my balance was $104,494, so this is quite a jump in the last 2 weeks). YTD I haven't made any deposits or withdrawals, so the increase in value was driven by an aggregate increase in my holdings.
- On an absolute basis, my portfolio gained 1.3% YTD while the S&P (w/ dividends reinvested) is up 6.1%.
- I've been tracking my returns for 4 years and 9+ months, during which time my annual rate of return is 14.6%. Over the same period the S&P returned 2.3% annually. In other words, over the last 4 years and 9+ months I've outperformed the S&P by about 12% per annum.

Thursday, September 30, 2010
My Returns as of Q3 2010
Well, the quarter's over so it's time to write a quick post on my returns - I started 2010 with $107,514 and finished the quarter with $104,494. I didn't make any deposits or withdrawals, so the decrease in value was driven by a decline in aggregate of my stocks.

- On an absolute basis, my portfolio declined 2.8% during the first three quarters of 2010. Annualized, this rate of return is -3.7%. YTD the S&P (w/ dividends reinvested) is up 3.5%.
- I've been tracking my returns for 4 years and 9 months, during which time my annual rate of return is 13.3%. Over the same period the S&P returned 1.5% annually. In other words, over 4 and half years I've been outperforming the S&P by about 11% per annum.

Wednesday, September 22, 2010
My Returns?
I got a comment from a reader today with regards to my investment returns, here's what he/she had to say:
probably making a mistake somewhere...
in one place you claim a 19.5% AR as of Mar 2010 and in another place you claim 13.4% AR as of Jun 2010
- 2006-2010 19.5% beats the best of the best of the best, gurufocus shows one investors with double digit 5yr average returns (10%), you are go(o)d!
- a 6% drop in one quarter in AR could only be caused by massive losses, what happened?
regards
Well first let me say I appreciate the kind words! Previously I've speculated that my out performance could simply be dumb luck, so for any readers who'd like to dive a little deeper the first thing you can do is go to the "My Returns So Far..." link to the right, which is under the "Pages" category. I update this page quarterly, so it has my returns from 1/1/2006 through Q2 2010. If you'd like to verify my calculations you can use your friendly XIRR function in Excel. Further, under the "Labels" category there's a link called "Returns," if you click on this it will pull up all my previous posts where these have been discussed.
As this reader correctly points out, my returns fluctuate like crazy - this is simply a biproduct of having a concentrated portfolio. If you check the "Transaction Alert" link under the "Labels" category you can see what I've bought/sold and get a feel for how I've generated my returns (or for this year, lackthereof)!
Leave a comment if you have any questions, or if you prefer you can email me at mevsemt@gmail.com
probably making a mistake somewhere...
in one place you claim a 19.5% AR as of Mar 2010 and in another place you claim 13.4% AR as of Jun 2010
- 2006-2010 19.5% beats the best of the best of the best, gurufocus shows one investors with double digit 5yr average returns (10%), you are go(o)d!
- a 6% drop in one quarter in AR could only be caused by massive losses, what happened?
regards
Well first let me say I appreciate the kind words! Previously I've speculated that my out performance could simply be dumb luck, so for any readers who'd like to dive a little deeper the first thing you can do is go to the "My Returns So Far..." link to the right, which is under the "Pages" category. I update this page quarterly, so it has my returns from 1/1/2006 through Q2 2010. If you'd like to verify my calculations you can use your friendly XIRR function in Excel. Further, under the "Labels" category there's a link called "Returns," if you click on this it will pull up all my previous posts where these have been discussed.
As this reader correctly points out, my returns fluctuate like crazy - this is simply a biproduct of having a concentrated portfolio. If you check the "Transaction Alert" link under the "Labels" category you can see what I've bought/sold and get a feel for how I've generated my returns (or for this year, lackthereof)!
Leave a comment if you have any questions, or if you prefer you can email me at mevsemt@gmail.com
Wednesday, August 25, 2010
Current Holdings and Random Musings
Well so far it's been a very tough Q3, both in absolute and relative terms. After marginally outperforming the S&P through Q2 things have taken a turn for the worse, and YTD I'm underperforming the S&P by a wide margin. However, with a highly concentrated portfolio, big swings in performance are bound to happen, and hopefully recent history isn't indicative of things to come.
For my current holdings, AHS in particular has been a thorn in my side. The company recently reported results, which weren't bad by any means. HOWEVER, the company also announced an acquisition which will be completely paid for with newly issued stock, thereby materially diluting existing shareholders. My estimate is this will destroy about $2 to $4 in value for existing shareholders. Of course, the stock has gone from $8'ish to $4'ish, which I think is an example of a typical "Mr. Market" over reatcion. All things considered, I think this stock is worth $10 to $15 per share (assuming management doesn't make a habit of diluting shareholders).
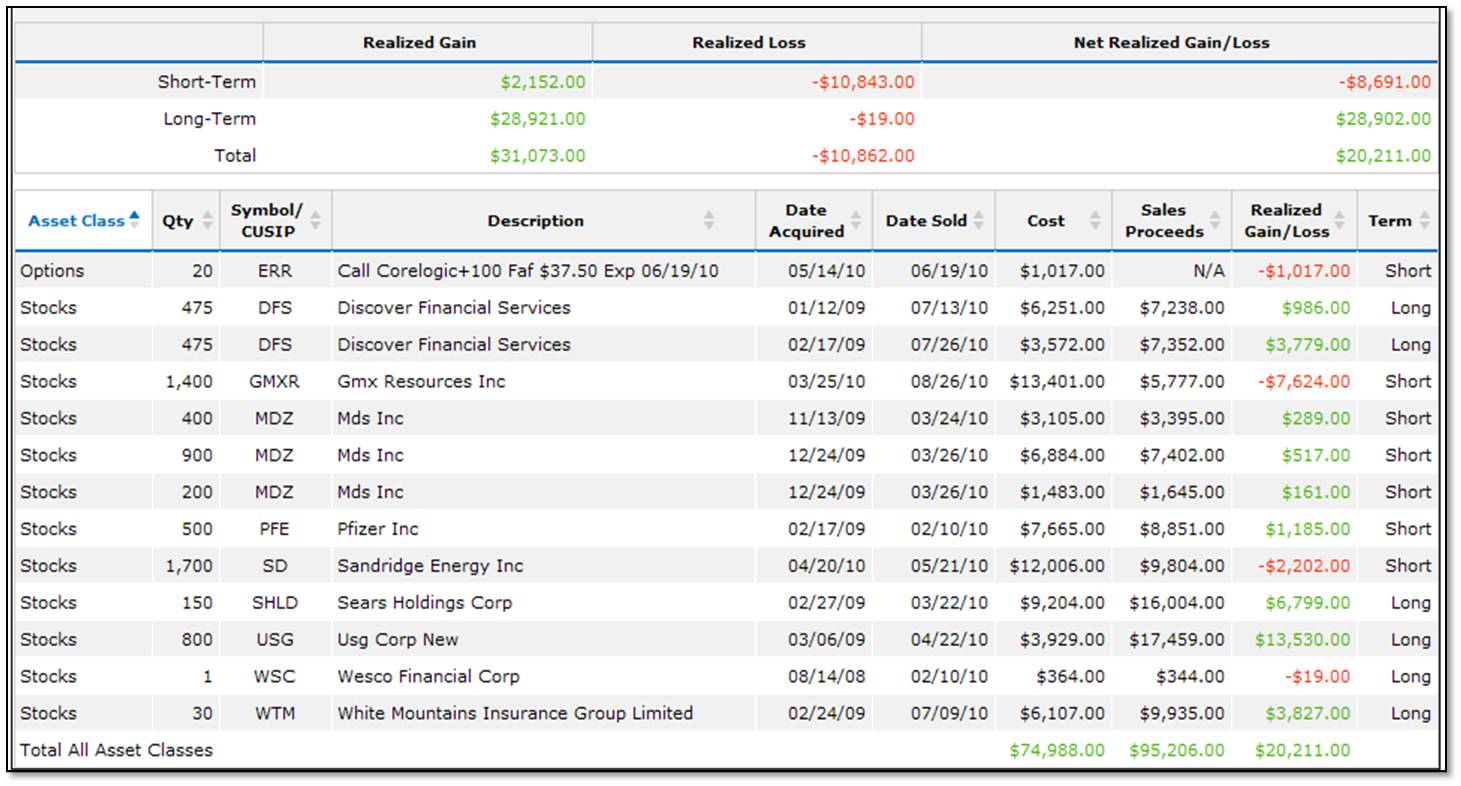
GMXR has also been a big thorn in my side. Natural gas stocks in general have been hammered, and GMXR in particular has been killed because of its high level of debt. I think the risk/reward proposition at today's price is pretty compelling, and I'm considering doing one of two things; 1) doubling down 2) trading GMXR for a similarly punished E&P company. The logic behind #2 is that my account is taxable, and with significant gains from SHLD, USG, WTM, and DFS, I'm sitting on roughly 28K of capital gains for 2010 (ouch!).
Generally I try to stay away from making broad market predictions, I figure I'm better served by trolling for pockets of opportunity. HOWEVER, I do read the predictions and observations of other smart investors, and I try to incorporate any inferences/insight when I make high-level portfolio allocation decisions. IMHO the two best sources for this are John Hussman's weekly comments (www.hussmanfunds.com) and pretty much anything published on PIMCO's website (although I'm partial to Bill Gross's monthly commentary). Again, this is just my opinion, but if you read everything they've published over the last six months (which will probably take a day or so) you'll automatically become a better investor.
Anyhow, right now I've got about 40K (or 43%) of my portfolio in cash (obviously this is a huge %), so clearly I'm worried about downside risk. This is in the realm of gut feel, but personally I'd be much more surprised if the DOW goes to 12K than if it goes to 8K. And assuming it does go to 8K it'll be nice to have some cash on the sidelines waiting to be deployed.
For my current holdings, AHS in particular has been a thorn in my side. The company recently reported results, which weren't bad by any means. HOWEVER, the company also announced an acquisition which will be completely paid for with newly issued stock, thereby materially diluting existing shareholders. My estimate is this will destroy about $2 to $4 in value for existing shareholders. Of course, the stock has gone from $8'ish to $4'ish, which I think is an example of a typical "Mr. Market" over reatcion. All things considered, I think this stock is worth $10 to $15 per share (assuming management doesn't make a habit of diluting shareholders).
GMXR has also been a big thorn in my side. Natural gas stocks in general have been hammered, and GMXR in particular has been killed because of its high level of debt. I think the risk/reward proposition at today's price is pretty compelling, and I'm considering doing one of two things; 1) doubling down 2) trading GMXR for a similarly punished E&P company. The logic behind #2 is that my account is taxable, and with significant gains from SHLD, USG, WTM, and DFS, I'm sitting on roughly 28K of capital gains for 2010 (ouch!).
Generally I try to stay away from making broad market predictions, I figure I'm better served by trolling for pockets of opportunity. HOWEVER, I do read the predictions and observations of other smart investors, and I try to incorporate any inferences/insight when I make high-level portfolio allocation decisions. IMHO the two best sources for this are John Hussman's weekly comments (www.hussmanfunds.com) and pretty much anything published on PIMCO's website (although I'm partial to Bill Gross's monthly commentary). Again, this is just my opinion, but if you read everything they've published over the last six months (which will probably take a day or so) you'll automatically become a better investor.
Anyhow, right now I've got about 40K (or 43%) of my portfolio in cash (obviously this is a huge %), so clearly I'm worried about downside risk. This is in the realm of gut feel, but personally I'd be much more surprised if the DOW goes to 12K than if it goes to 8K. And assuming it does go to 8K it'll be nice to have some cash on the sidelines waiting to be deployed.
Tuesday, July 6, 2010
My Returns as of Q2 2010
I started 2010 with $107,514 in my portfolio and finished the quarter with $101,294. I didn't make any deposits or withdrawals, so the decrease in value was driven by a decline in aggregate of my stocks.
- On an absolute basis, my portfolio declined 5.8% during the first two quarters of 2010. Annualized, this rate of return is -11.3% (although negative, this is still slightly better than the S&P).
- I've been tracking my returns for 4 years and 6 months, during which time my annual rate of return is 13.4%. Over the same period the S&P returned -1.9% annually. In other words, over 4 and half years I've outperformed the S&P by over 15% annually.
Obviously, beating the S&P by 15% every year is quite good. HOWEVER, as I've said before, I have a very concentrated portfolio - a few good picks can make a huge difference in performance - so I still have no idea whether I'm just lucky or if I'm doing something right...
Thursday, April 15, 2010
Updated Returns
I last posted about my portfolio returns at the end of Q1, but due to the recent runup I thought I'd recalculate (see "My Returns So Far..." to the right). Over the past 4 years and 3+ months my annual rate of return is 21.4%. Over this same time period the "S&P parallel portfolio" would've returned 3.5%.
I realize that 4+ years is not long enough to know if my results are simply dumb luck, so I'm keeping my fingers crossed and hoping the streek continues!
I realize that 4+ years is not long enough to know if my results are simply dumb luck, so I'm keeping my fingers crossed and hoping the streek continues!
Subscribe to:
Posts (Atom)