When I posted my returns at the end of Q3 one reader correctly pointed out that I wasn't showing my cost basis for each holding. At the time TradeKing was doing some sort of behind-the-scenes IT conversion and didn't display cost basis on their summary pages. They've since finished the conversion, so I thought I'd post a quick update on my returns and update the "My Returns So Far..." and "My Current Holdings" pages.
I started 2010 with $107,514 and as of 10/12/2010 my account balance is $108,885 (Note: as of Q3 when I last posted about my returns my balance was $104,494, so this is quite a jump in the last 2 weeks). YTD I haven't made any deposits or
withdrawals, so the increase in value was driven by an aggregate increase in my holdings.
- On an absolute basis, my portfolio gained 1.3% YTD while the S&P (w/ dividends reinvested) is up 6.1%.
- I've been tracking my returns for 4 years and 9+ months, during which time my annual rate of return is 14.6%. Over the same period the S&P returned 2.3% annually. In other words, over the last 4 years and 9+ months I've outperformed the S&P by about 12% per annum.
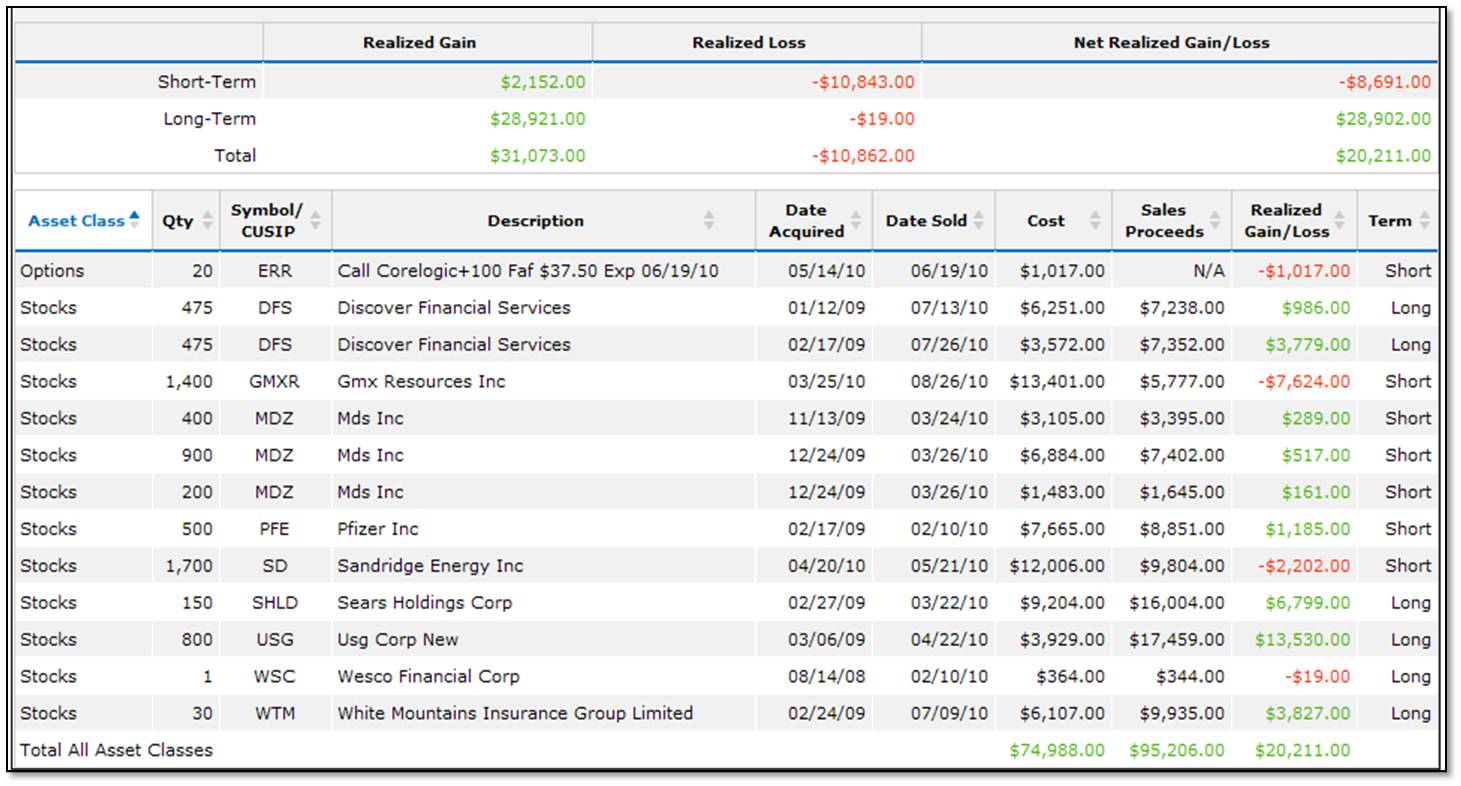
However, I'm still underperforming the S&P for 2010, but as I mentioned last time I have a very concentrated portfolio and I'm pretty optimistic about my holdings - so I'm not overly concerned that YTD I've been lagging the S&P. Below are two pictures (click to enlarge), one for my current holdings (this is actually 2 displays b/c only the bottom grid shows my cash balance) and one for my 2010 realized gains & losses.